
Winchester's under-25 claimant count rose 9.3% in two years, the smallest rise of Hampshire's 11 districts. Hart's rose 60.9%. July 2026 figures, ranked.
Winchester district has the shallowest rise in young people claiming unemployment-related benefits of any district in Hampshire. Over the two years to July 2026 the number of 18 to 24 year olds on the claimant count here went up 9.3 per cent. Across Hampshire as a whole the same measure rose 26.6 per cent, and in Hart it rose 60.9 per cent.
The figures come from the ONS claimant count on nomis, dataset NM_162_1, released at 7am on 18 August 2026.
In Winchester district in July 2026 there were 1,685 people on the claimant count, which is 2.0 per cent of residents aged 16 to 64. That is 50 more than in July 2025, and 100 fewer than in July 2024.
Every Hampshire district ranked, 18 to 24 year olds
This is the change in the number of 18 to 24 year olds on the claimant count between July 2024 and July 2026. July is compared with July because the figures are not seasonally adjusted.
| District | July 2024 | July 2026 | Change |
|---|---|---|---|
| Hart | 115 | 185 | +60.9% |
| New Forest | 330 | 470 | +42.4% |
| Test Valley | 230 | 310 | +34.8% |
| Basingstoke and Deane | 520 | 695 | +33.7% |
| East Hampshire | 210 | 270 | +28.6% |
| Fareham | 215 | 275 | +27.9% |
| Eastleigh | 320 | 395 | +23.4% |
| Rushmoor | 300 | 370 | +23.3% |
| Havant | 470 | 570 | +21.3% |
| Gosport | 365 | 420 | +15.1% |
| Winchester | 270 | 295 | +9.3% |
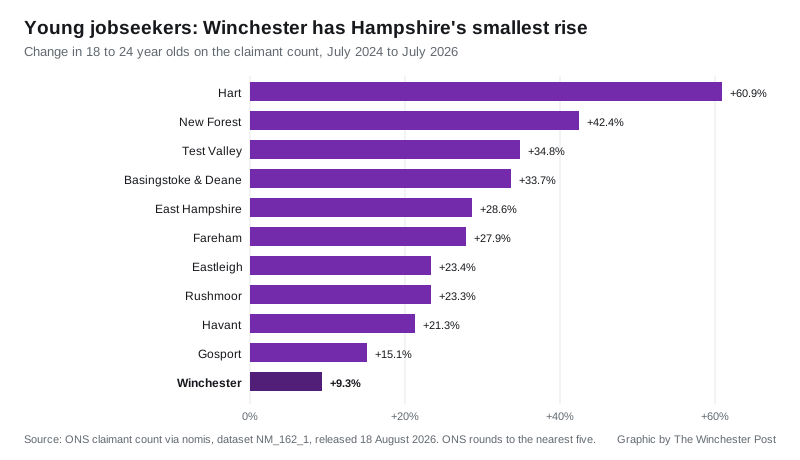
One caution about that table. These are small numbers, and ONS rounds every figure to the nearest five. A district with only a couple of hundred young claimants will swing much harder in percentage terms than one with several hundred. Hart’s 60.9 per cent is a rise of 70 people. Winchester’s 9.3 per cent is a rise of 25.
The district total hides two opposite movements
Winchester’s headline number has barely shifted in two years, and that stillness is misleading. Underneath it, two age groups are moving in opposite directions:
- 18 to 24: 270 in July 2024, 260 in July 2025, 295 in July 2026. Up 9.3 per cent over two years.
- 25 to 49: 1,035 in July 2024, 935 in July 2025, 925 in July 2026. Down 10.6 per cent over two years.
So the group most people would call early-career is the only one growing, while the larger prime-age group has fallen back. The same shape appears at every level above the district, but more sharply. Across Hampshire the 18 to 24 count rose 26.6 per cent over the two years, in the South East 21.7 per cent, and across the UK 15.7 per cent. Winchester’s 9.3 per cent is roughly a third of the county’s rate.
Winchester’s rate of 2.0 per cent of working-age residents puts it joint third-lowest in Hampshire, level with Fareham and Test Valley, behind Hart on 1.8 per cent. Gosport is highest at 3.6 per cent, followed by Havant on 3.3 per cent and Rushmoor on 3.0 per cent.
What the claimant count is, and is not
This matters, because the number gets reported as if it were an unemployment rate. It is not.
- The claimant count records people claiming benefits principally for being unemployed. It is a count of claims, not a measure of everyone out of work.
- It includes some people who are working, on low earnings, where Universal Credit conditions require them to look for more or better-paid work. That is why it sits above the old Jobseeker’s Allowance count.
- The figures are not seasonally adjusted. July always carries school and college leavers, which is why every comparison here is July against July.
- ONS rounds to the nearest five, so small differences between districts are not meaningful.
What it means for you
If you are looking for work in the district, the useful signal is that Winchester is not where the sharpest deterioration is happening. The pressure across Hampshire is concentrated on the under-25s, and it is much heavier in Hart, the New Forest and Test Valley than it is here. If you are job-hunting and willing to travel, that pattern is worth knowing before you decide where to focus.
If you are already claiming, the count includes people in work on low earnings, so being in a job does not automatically take you off it. Check what your own commitments require rather than assuming.
The next monthly release, covering August 2026, is scheduled for 15 September 2026.
Sources
- ONS claimant count, dataset NM_162_1, via nomis, released 18 August 2026
- Geography codes: Winchester E07000094, Hampshire E10000014, South East E12000008
Elsewhere on the site: Winchester house prices, Winchester planning news and Winchester roadworks and travel.
Have your say