
The average Winchester home sold for £463,025 in July 2026, up 2.1% on the year but down for a second month. Prices by type, and why Rightmove says £617,762.
The average home in the Winchester district sold for £463,025 in July 2026. That is up 2.1 per cent on July last year, and down for the second month running.
Both of those are true at once, and the second one is the part most summaries leave out. Prices in the district peaked for this year at £476,328 in May, then fell in June and again in July.
Our report on the July 2026 release has the full month by month picture, including the figure the Land Registry quietly revised.
These are completed sales recorded by HM Land Registry, not asking prices. The figures come from the UK House Price Index for Winchester district, and cover the whole local authority: the city, Alresford, Bishop’s Waltham, Wickham, Denmead, the Worthys and the villages of the Meon valley and the downs.
The headline, and the longer view
| Measure | July 2025 | July 2026 |
|---|---|---|
| Average price | £453,506 | £463,025 |
| Annual change | −3.0% | +2.1% |
| Flats and maisonettes | −5.5% | −0.2% |
The index is set to 100 in January 2023, when the district average was £480,156. In July 2026 the index reads 96.4. In cash terms the average Winchester home is £17,131 cheaper than it was three and a half years ago, before any allowance for inflation.
So the fair description of this market is not a boom and not a slump. Prices fell hard through 2024 and the first half of 2025, bottomed at £450,396 in June 2025, and have clawed back most but not all of that ground.
One habit worth picking up: the newest two or three months of this index are the least reliable part of it, because sales keep completing after the first estimate is published. June 2026 was first published at £471,136 and has since been revised down to £467,735.
Prices by property type
The average hides a spread of more than half a million pounds between a flat and a detached house. These are the Winchester district averages for July 2026, with the change over the year:
| Property type | Average price | Annual change |
|---|---|---|
| Detached | £746,246 | +2.0% |
| Semi-detached | £469,390 | +3.1% |
| Terraced | £390,267 | +2.9% |
| Flat or maisonette | £229,970 | −0.2% |
Semi-detached houses are leading, up 3.1 per cent, with terraces close behind. Flats are the only type worth less than a year ago, and the gap widens over the longer run. A Winchester flat averaged £250,815 in January 2023 and averages £229,970 now, a fall of 8.3 per cent against 3.6 per cent for the district as a whole.
That pattern repeats across most of the South East. Family houses with gardens have held their demand. The flat market, which is the most exposed to mortgage rates, service charges and cladding-era caution, has not recovered.
Note where the semi-detached figure sits. At £469,390 it is above the district’s all-property average of £463,025, because the average is dragged down by flats. In Winchester, a semi is not the cheap option.
First-time buyers and movers
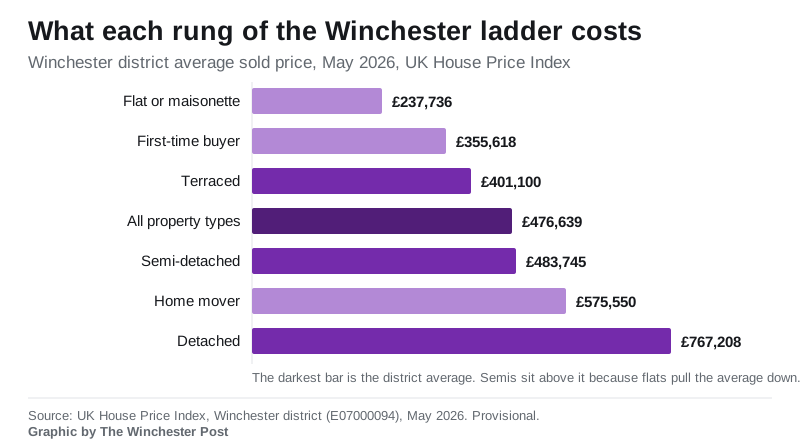
A first-time buyer in the Winchester district paid an average of £345,021 in July 2026, up 2.3 per cent on the year. A home mover, someone selling one property to buy another, paid £559,458, up 2.1 per cent.
The £214,437 between those two numbers is the real cost of the step from a first flat or terrace to a family house here, and it is the reason so many people commute in from further down the M3 or the Meon valley. On the same data, buyers paying cash averaged £466,475 and buyers with a mortgage £461,754, which is unusually close; in most expensive districts the cash figure runs well ahead.
Why Rightmove says £617,762
Search Winchester on Rightmove and you will see an average sold price of £617,762 over the last year, with detached houses at £944,672, semis at £648,132 and terraces at £547,056. That is nearly £155,000 above the Land Registry district figure, and both are correct.
The difference is geography. The UK House Price Index covers the whole local authority, including the flats and terraces of the outlying towns and villages. Rightmove’s Winchester page covers the town search area, weighted towards the large period houses of the city and its immediate edges, where a single sale can run past £2 million. Rightmove also notes that its Winchester average is about 5 per cent below the 2022 peak of £648,280.
Before you compare any two house-price figures, check three things: which area they cover, whether they are sold prices or asking prices, and which months they run over. Most apparent contradictions are one of those three.
How Winchester compares
| Area | Average price | Annual change |
|---|---|---|
| Winchester district | £463,025 | +2.1% |
| East Hampshire | £440,541 | −1.2% |
| Test Valley | £368,131 | −0.6% |
| Eastleigh | £310,283 | +2.6% |
| Hampshire | £364,336 | +0.9% |
| South East | £380,878 | +0.2% |
| England | £293,479 | +1.1% |
Winchester costs £98,689 more than the Hampshire average and 58 per cent more than the England average. It is the dearest district in this group by a wide margin, and one of only two here rising faster than England as a whole.
What holds the premium up is not mysterious: an hour to London Waterloo on a direct train, a cathedral city centre almost entirely within a conservation area, strong schools, and a district where most of the undeveloped land is either in the South Downs National Park or otherwise constrained. The adopted Local Plan requires 687 homes a year across the Winchester plan area, which is a modest number against that demand. Our guide to Winchester planning news sets out where those homes are meant to go.
Frequently asked questions
What is the average house price in Winchester?
£463,025 in July 2026 across the Winchester district, on the provisional UK House Price Index built from HM Land Registry sales. The figure for the town search area alone is higher: Rightmove reports £617,762 over the last year.
Are Winchester house prices going up or down?
Both, depending on the window. Prices were up 2.1 per cent in the year to July 2026, but down 1.0 per cent in the month and down for a second month in a row. Over three and a half years they are lower: the district average is £17,131 below its January 2023 level.
How much is a detached house in Winchester?
About £746,246 across the district in July 2026, up 2.0 per cent on the year. In the town itself, Rightmove’s last-year average for detached homes is £944,672.
What does a first-time buyer pay in Winchester?
An average of £345,021 in July 2026, up 2.3 per cent on the year.
Is Winchester more expensive than the rest of Hampshire?
Substantially. The district average is £463,025 against a county average of £364,336, a gap of £98,689, and Winchester prices are rising while East Hampshire and Test Valley are falling.
Where can I check what a specific house sold for?
Every completed sale in England and Wales is public. Look up an address or a street free on HM Land Registry Price Paid, or browse the same data through Rightmove and Zoopla.
Sources
- UK House Price Index, Winchester (ONS and HM Land Registry) for district averages, property type and buyer type figures.
- HM Land Registry UKHPI data for Winchester, East Hampshire, Test Valley, Eastleigh, Hampshire, the South East and England, July 2025 and July 2026, via the Land Registry open data service.
- Rightmove Winchester sold prices for town search area context, checked 18 September 2026.
- HM Land Registry Price Paid search for individual addresses.
UK House Price Index figures are provisional and revised as more sales complete. Confirm the latest numbers against the linked sources before making a decision.
Thinking about the commute? Winchester train times to London has the journey times and the £6,728 annual season ticket that goes with the postcode.
Have your say