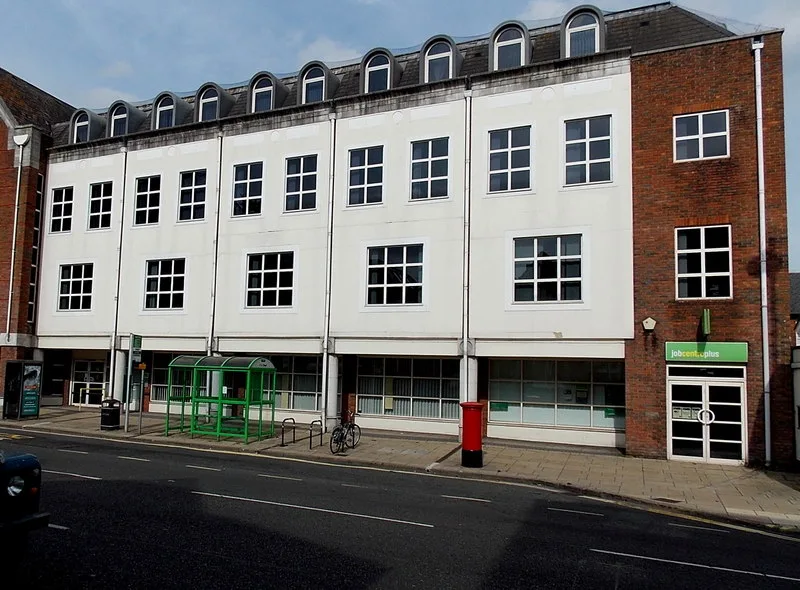

Winchester district had 1,670 claimants in September, exactly the same as a year ago, while Hampshire rose 3.5%. St Luke ward has the highest rate, at 3.6%.
The number of people claiming unemployment-related benefits in Winchester district has not moved in a year. In September 2026 there were 1,670 people on the claimant count. In September 2025 there were also 1,670.
Across Hampshire the count rose 3.5 per cent over the same year. Nine of the county’s 11 districts went up. Havant was the only one to fall.
The figures are from the ONS claimant count on nomis, dataset NM_162_1. They were released at 7am on 20 October 2026.
Winchester against the rest of Hampshire
September is compared with September because the figures are not seasonally adjusted. The rate is claimants as a share of residents aged 16 to 64.
| District | Sept 2025 | Sept 2026 | Change | Rate, Sept 2026 |
|---|---|---|---|---|
| East Hampshire | 1,510 | 1,640 | +8.6% | 2.2% |
| Hart | 1,005 | 1,090 | +8.5% | 1.7% |
| Gosport | 1,690 | 1,825 | +8.0% | 3.7% |
| Basingstoke and Deane | 3,140 | 3,335 | +6.2% | 2.7% |
| Test Valley | 1,535 | 1,610 | +4.9% | 2.0% |
| Eastleigh | 1,920 | 2,010 | +4.7% | 2.3% |
| Rushmoor | 2,005 | 2,095 | +4.5% | 3.0% |
| Fareham | 1,315 | 1,335 | +1.5% | 2.0% |
| New Forest | 2,225 | 2,250 | +1.1% | 2.3% |
| Winchester | 1,670 | 1,670 | 0.0% | 2.0% |
| Havant | 2,540 | 2,415 | -4.9% | 3.3% |
| Hampshire | 20,550 | 21,270 | +3.5% | 2.5% |
Winchester’s rate of 2.0 per cent is joint second lowest in the county, level with Fareham and Test Valley. Only Hart is lower, on 1.7 per cent. The South East rate is 3.1 per cent and the UK rate 3.9 per cent.
Over the month, Winchester’s count rose by 15, from 1,655 in August. Hampshire’s rose by 460. The UK total went up by about 35,800 between August and September.
Which wards have the most claimants
The district total hides big differences between neighbourhoods. ONS publishes the count for each of the district’s 16 wards, on the boundaries in force since May 2025.
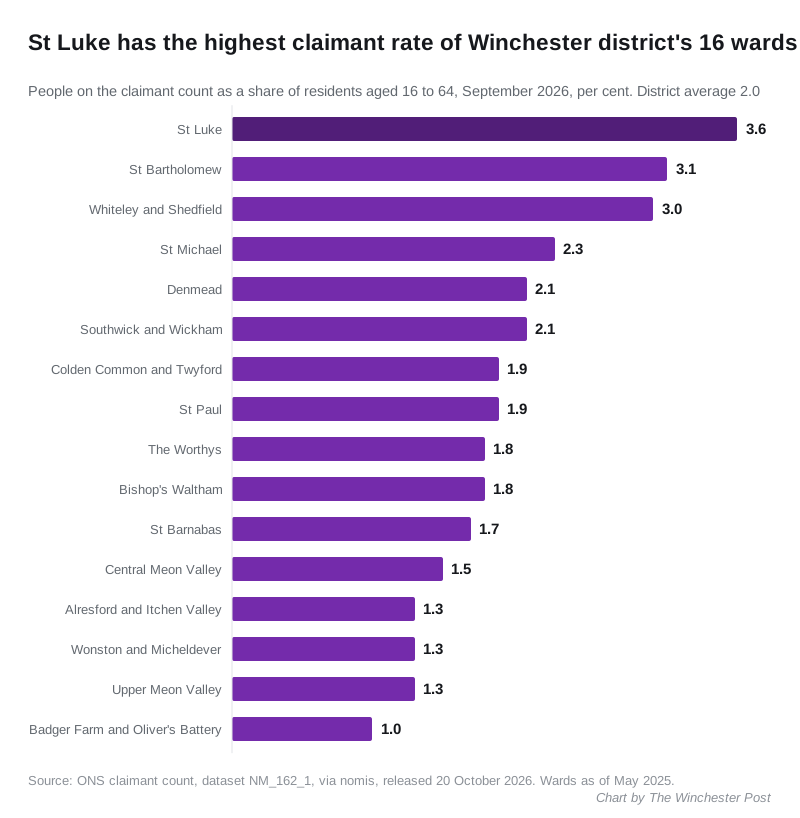
Three wards stand well above the district rate of 2.0 per cent:
- St Luke: 160 claimants, 3.6 per cent, the highest rate in the district
- St Bartholomew: 210 claimants, 3.1 per cent, the largest number in any ward
- Whiteley and Shedfield: 175 claimants, 3.0 per cent
At the other end, Badger Farm and Oliver’s Battery has 50 claimants, a rate of 1.0 per cent. Alresford and Itchen Valley, Wonston and Micheldever and Upper Meon Valley are all on 1.3 per cent.
The ward series on these boundaries starts in January 2026, so it cannot yet be compared with a year ago. Since January the clearest rise is in St Paul, from 110 to 140. That is a small number, and every ward figure is rounded to the nearest five, so treat it as a movement to watch rather than a trend.
Who is claiming
By age, the district’s 1,670 claimants in September 2026 break down like this, with September 2025 in brackets:
- 16 to 24: 320 (300)
- 25 to 49: 930 (930)
- 50 and over: 420 (440)
So the flat total is not quite flat underneath. There are 20 more young claimants and 20 fewer aged 50 and over. Both moves are small and close to the rounding, but the rise among the under-25s matches what we reported from the July figures, when Winchester’s young claimant count was rising more slowly than anywhere else in Hampshire.
What the claimant count is, and is not
The count is often reported as if it were an unemployment rate. It is not.
- It records people claiming benefits principally because they are unemployed. It is a count of claims, not of everyone out of work.
- It includes some people in work on low earnings, where Universal Credit rules require them to look for more or better-paid work.
- The figures are not seasonally adjusted, which is why we compare the same month a year apart.
- ONS rounds every figure to the nearest five, so small differences between wards and districts mean little.
What it means for you
If you are looking for work, Winchester is holding steady while most of Hampshire is drifting up. The district’s rate is about half the UK’s.
That is a district average, though. In St Luke and St Bartholomew the rate is more than one and a half times the district’s. If you live there and need help finding work, Jobcentre Plus is the starting point (how to contact it, on GOV.UK).
The next release, covering October 2026, is due from ONS in November.
Sources
- ONS claimant count, dataset NM_162_1, via nomis, released 20 October 2026
- Geography codes: Winchester E07000094, Hampshire E10000014, South East E12000008; wards as of May 2025
Elsewhere on the site: Winchester house prices, Winchester planning news and Winchester roadworks and travel.
Have your say